
13 · Insights, the report builder & Inky Accounting
The rest of the Financials tab. Three tabs come with Inky Mall OS Pro — Insights, Locations and the Report builder — and three come with Inky Accounting — Profit & Loss, Expenses and Year-end tax. Everything from Financials & reports still applies: the period, the filters and the exports at the top work on these tabs too.
If a tab shows a lock, it tells you what it needs and where to get it; the numbers behind it are being kept regardless, so nothing is lost by turning it on later.
Insights
The dashboard: not what sold, but how the shop is doing.
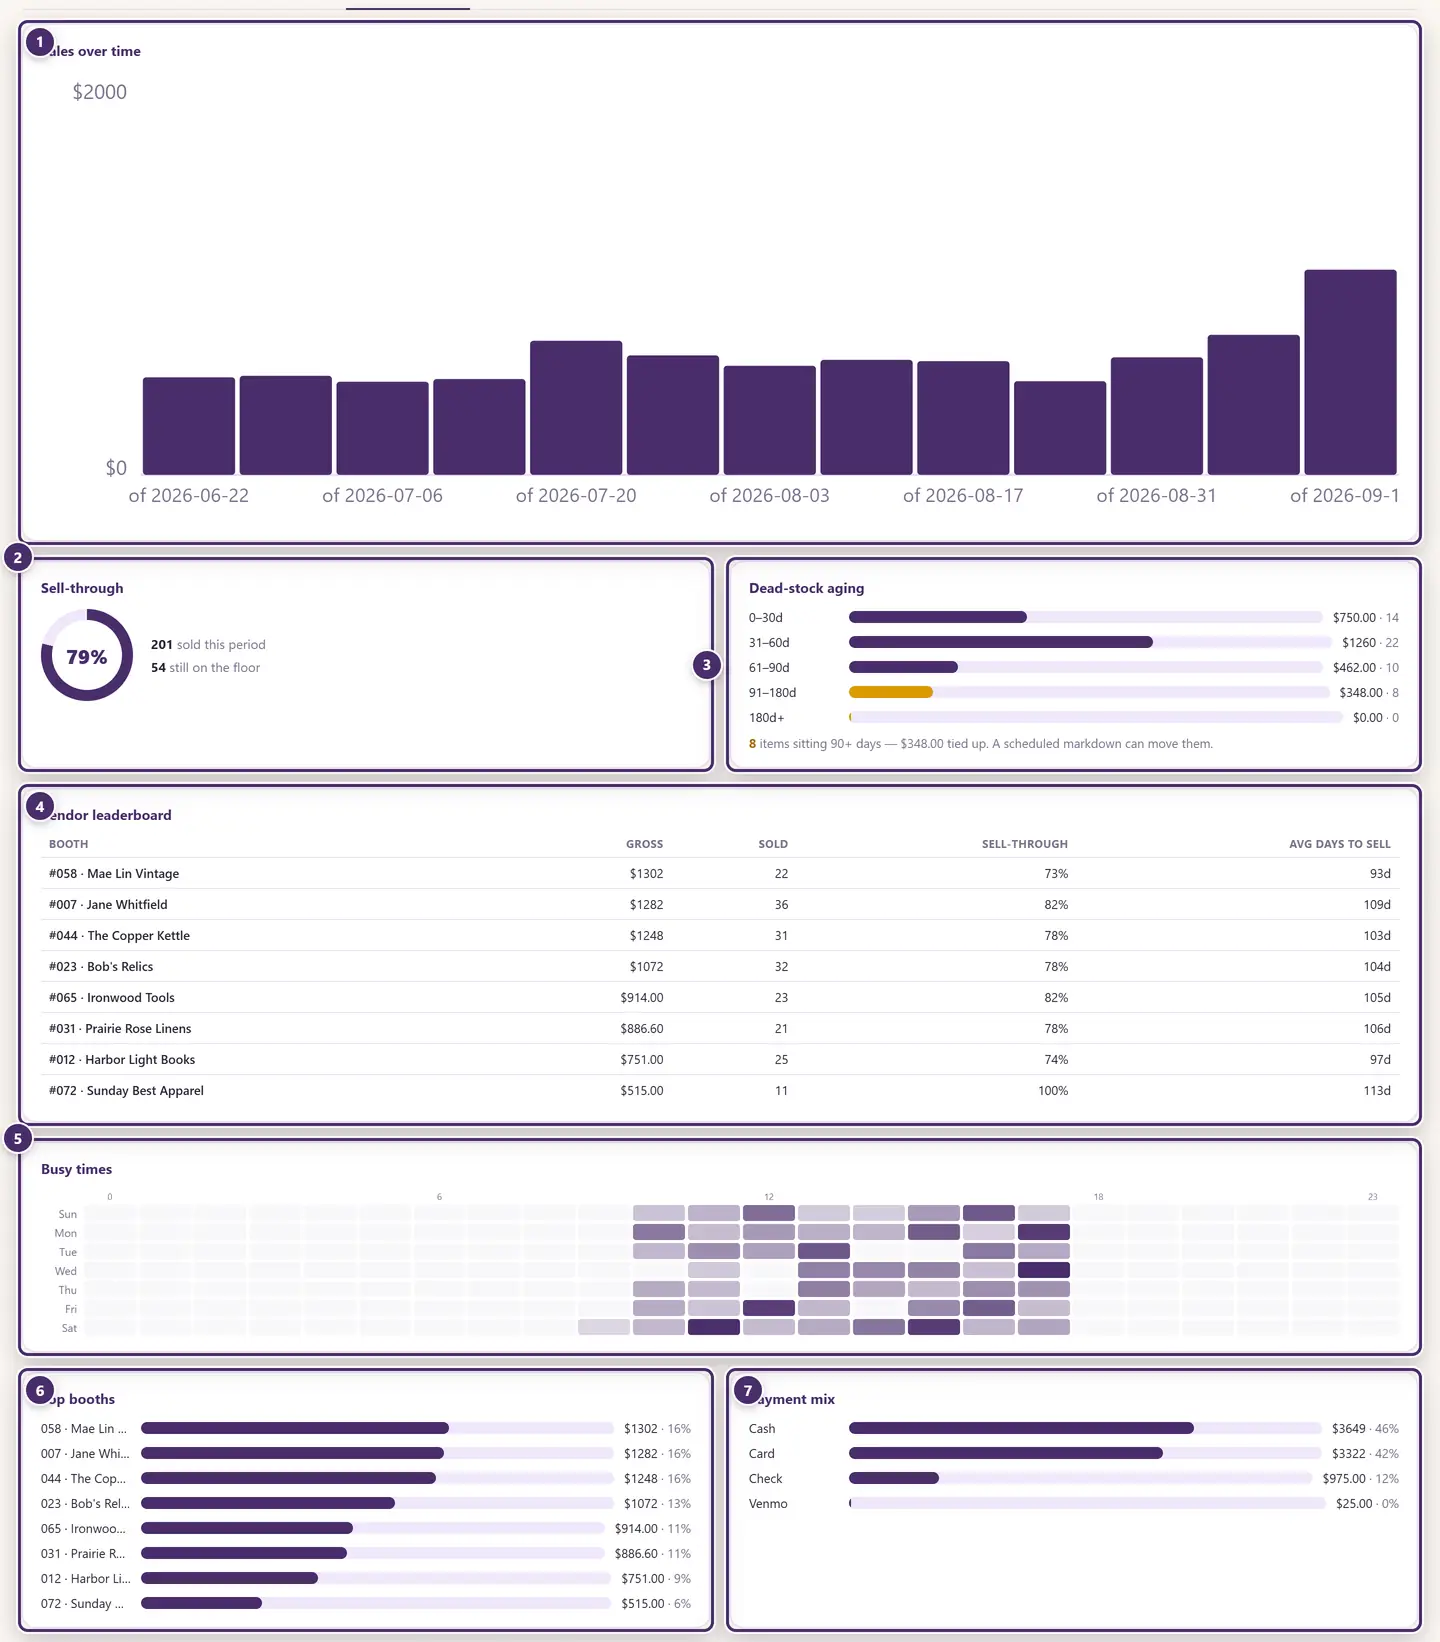
- Sales over time for the period, by week.
- Sell-through — how much of what went out on the floor has sold, and how much is still sitting.
- Dead-stock aging — what's been on the floor 0–30 days, 31–60, and so on, how many items and how much money each band ties up. This is the chart that argues for an automatic markdown.
- Vendor leaderboard — the booths ranked by gross, with units sold, each booth's sell-through, and the average days an item takes to sell there.
- Busy times — a heat map of the week: which hours and which days the counter is busiest. Staff the Saturday afternoon, not the Tuesday morning.
- Top booths by share of gross.
- Payment mix — how customers paid.
Insights reads the whole catalog and the whole sales history, so it is honest about a slow booth. That is what it's for.
The report builder
When none of the fixed reports answers the question.
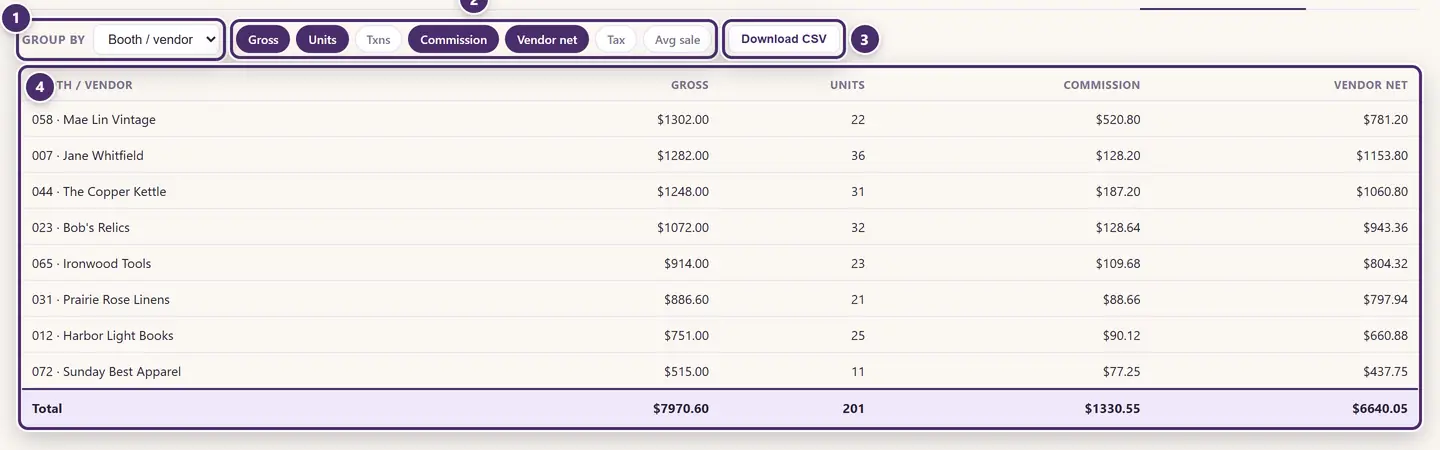
- Group by booth, day, week, month, payment type, or tax category.
- The metrics — gross, units, transactions, commission, vendor net, tax, average sale. Click a chip to turn a column on or off.
- Download exactly this table as a CSV.
- The breakdown, with a totals row.
Gross by week for booth 44, commission by payment type this year, units by month — set the period and filters at the top, pick the grouping, and it's there. A saved view brings you back to this tab with the same period and filters; pick the grouping again.
Locations

- One line per location — gross, transactions, your income, vendor earnings and tax — for a shop that runs more than one store from this Inky. A single-location shop sees one line and a total that matches it. Adding a location is in Your data.
Inky Accounting
The bookkeeping side: what the shop earned, against what it spent. Two things to know before reading it:
- Revenue means the shop's income — commission plus booth rent. The booths' share of sales is the booths' money and never appears as revenue. Gross sales are shown for context only.
- Expenses are entered on the web. Inky Accounting on get-inky.com is where bills are recorded, receipts attached, and recurring ones — rent, utilities, insurance — set up to post themselves each month. The desktop shows the books live; it doesn't edit them.
Profit & Loss
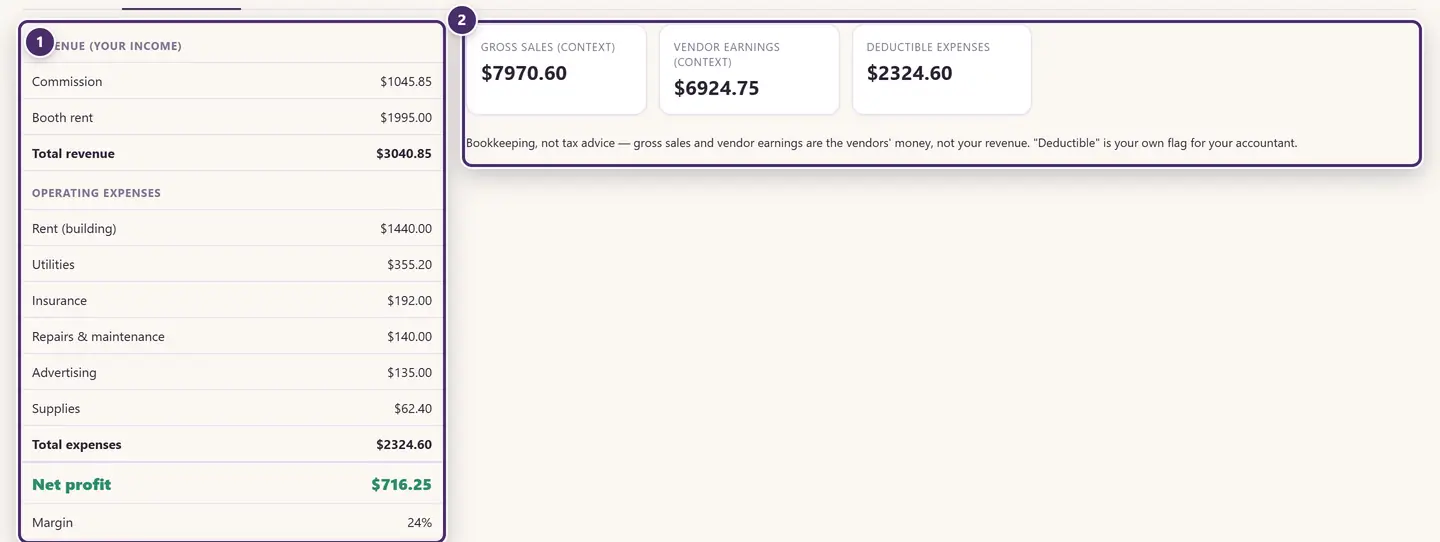
- The statement for the period. Commission and booth rent make the revenue; operating expenses come off by category; what's left is net profit (or loss), and the margin.
- For context: gross sales, vendor earnings, and how much of the period's expenses is flagged deductible.
Booth rent is counted by the month: a month's rent lands in the period that contains the first of that month. A shop in its first weeks sees no rent income until the first of the following month.
Expenses
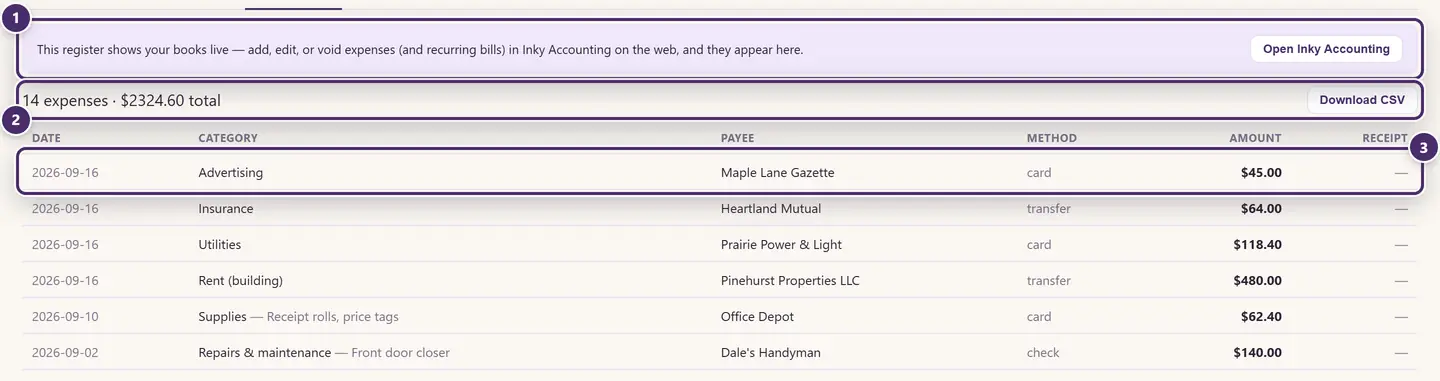
- Where expenses are entered — Inky Accounting on the web. The button opens it.
- How many in the period, and a CSV.
- One expense: the date, its category, the payee, how it was paid, the amount, and a thumbnail of the receipt if one was attached. non-ded marks one flagged as not deductible; a note, if there is one, sits under the category.
Year-end tax
The two worksheets an accountant asks for in January.
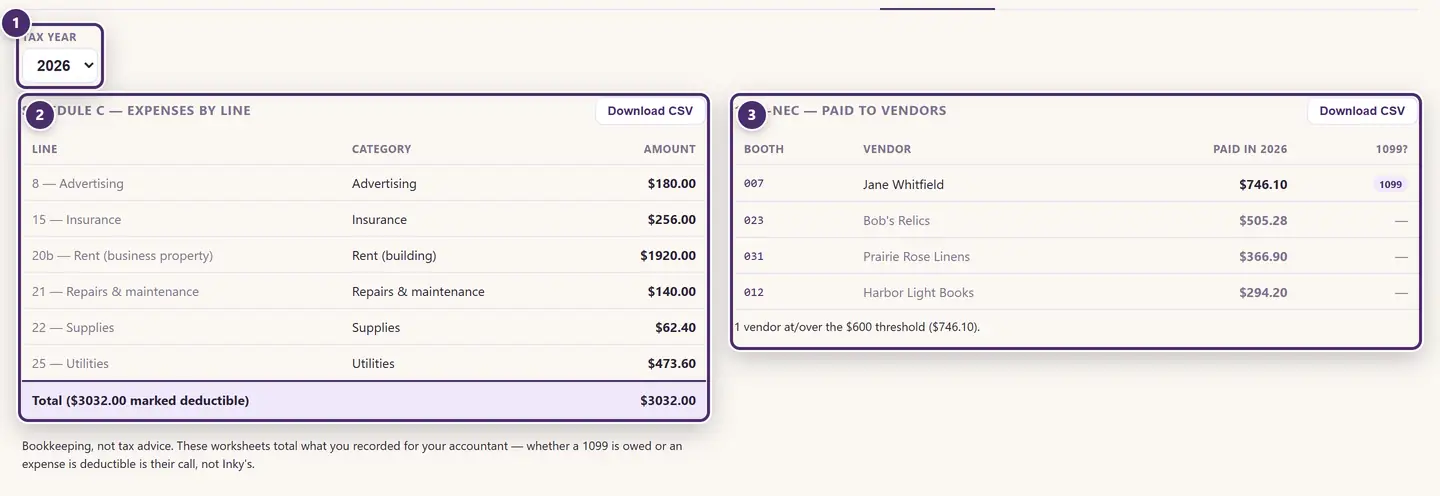
- Which tax year.
- Schedule C — expenses by line. The year's expenses already sorted onto the lines of the form, with the total and how much of it was flagged deductible.
- 1099-NEC — paid to vendors. What each booth was actually paid in the year, from closed payouts, with the ones at or over the reporting threshold flagged. Each table has its own CSV.
As the screen says: bookkeeping, not tax advice. The worksheets total what you recorded; whether a 1099 is owed or an expense is deductible is your accountant's call.
When the internet is out
Insights, the report builder, Locations and all three Accounting tabs are built from the data on this computer, so they work offline. New expenses entered on the web arrive when the store next syncs.
Guide for Inky Mall OS 0.16.0, updated Nov 20, 2026 · Download the whole guide (PDF)